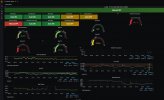
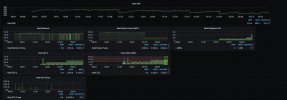
This is not a "click these buttons and it all magically works" post - there is just way too much for me to type up. This will give you everything you need in order to replicate my data/chart solution - as long as you are computer literate, have some patience and are willing to poke at things until they work the way you like. With that being said I'm happy to try to point you in the right direction - or tell you whats wrong if I know - if you hit any stumbling blocks.
If enough people are interested in this and having a rough go of it - I'll do a zoom meeting or record a video of me putting one together for people to reference.
Several times I’ve been asked about the graphs I have for my tanks. Couple images at the bottom to give you a general idea. I am able to see all the data that my apex collects for however long I have been running this little setup. I'll never lose or not have access to all data (unless I screw it up somehow of course).
This is an area where all controllers are lacking in my opinion - being able to track all the data from your tank, over a long period of time, can be an important tool in maintaining your reef or frag tanks. You can do it in spreadsheets, on paper or many other means - I personally like to have it available to me on any of my electronic devices no matter where I am.
Here is how I accomplished that:
Short answer is - I use a telegraf agent to scrape the data URL endpoint of my Apex, load that data in to an influx database and then use Grafana to visualize the data. All running on a cheap raspberry pi that I’ve made accessible over the internet - that “accessible over the internet” part is too complex for this post and I’m not going to go over that piece. You can still use all this data from inside your home network without providing internet access. This could also (most of it at least) be hosted in some cloud service if you wanted to do that.
What you need (other than your tank and apex of course):
ANY raspberry pi - I’ve run it on a $10 Pi W all the way up to the latest v4
That’s it - everything else you need is free (it’s all free software)!
1. Install your OS on the Raspberry Pi - get it up and running, accessible etc - there are a ton of online tutorials.
2. Set up a “tig” stack on your pi - check out how to do that at https://www.mm218.dev/posts/2020/05/ . Do not worry about the telegraf configuration he shows you in this tutorial - you don’t need that as the link below will give you one that works for apex.
3. Then - go to https://github.com/chvvkumar/apex - and follow the readme.md - the thing to notice here is he is showing you how to configure your apex to allow access to the data, then he is giving you what you need to add to your telegraf configuration.
4. Add your influxDB data source to grafana -
You can import the graphs from the github link above - it’s not going to work perfectly but it will get you a bunch of charts that you can then go to the settings of and see pretty easy how to customize grafana. Again - there are tons of tutorials out on the internet. Grafana is a very popular tool and has tremendous community support available.
Below is one of my dashboards showing tank data - everything from any temperature I measure, ph, all my trident readings, power consumption per outlet, I can graph when an outlet turns on / off, I can have grafana alert me if I want - you get the picture. It's powerful and allows me to be in charge. I can tell you when I do water changes based on jumps in m y parameters from the graphs below (look at the ORP chart near the bottom - see those jumps? - yep, water change). You can also see when I've done something stupid - like let the trident run out of reagent for instance.


If enough people are interested in this and having a rough go of it - I'll do a zoom meeting or record a video of me putting one together for people to reference.
Several times I’ve been asked about the graphs I have for my tanks. Couple images at the bottom to give you a general idea. I am able to see all the data that my apex collects for however long I have been running this little setup. I'll never lose or not have access to all data (unless I screw it up somehow of course).
This is an area where all controllers are lacking in my opinion - being able to track all the data from your tank, over a long period of time, can be an important tool in maintaining your reef or frag tanks. You can do it in spreadsheets, on paper or many other means - I personally like to have it available to me on any of my electronic devices no matter where I am.
Here is how I accomplished that:
Short answer is - I use a telegraf agent to scrape the data URL endpoint of my Apex, load that data in to an influx database and then use Grafana to visualize the data. All running on a cheap raspberry pi that I’ve made accessible over the internet - that “accessible over the internet” part is too complex for this post and I’m not going to go over that piece. You can still use all this data from inside your home network without providing internet access. This could also (most of it at least) be hosted in some cloud service if you wanted to do that.
What you need (other than your tank and apex of course):
ANY raspberry pi - I’ve run it on a $10 Pi W all the way up to the latest v4
That’s it - everything else you need is free (it’s all free software)!
1. Install your OS on the Raspberry Pi - get it up and running, accessible etc - there are a ton of online tutorials.
2. Set up a “tig” stack on your pi - check out how to do that at https://www.mm218.dev/posts/2020/05/ . Do not worry about the telegraf configuration he shows you in this tutorial - you don’t need that as the link below will give you one that works for apex.
3. Then - go to https://github.com/chvvkumar/apex - and follow the readme.md - the thing to notice here is he is showing you how to configure your apex to allow access to the data, then he is giving you what you need to add to your telegraf configuration.
4. Add your influxDB data source to grafana -
- Log in to your newly installed Grafana user interface
- Open the side menu by clicking the Grafana icon in the top header.
- In the side menu under the Dashboards link you should find a link named Data Sources.
- Click the + Add data source button in the top header.
- Select InfluxDB from the Type dropdown.
You can import the graphs from the github link above - it’s not going to work perfectly but it will get you a bunch of charts that you can then go to the settings of and see pretty easy how to customize grafana. Again - there are tons of tutorials out on the internet. Grafana is a very popular tool and has tremendous community support available.
Below is one of my dashboards showing tank data - everything from any temperature I measure, ph, all my trident readings, power consumption per outlet, I can graph when an outlet turns on / off, I can have grafana alert me if I want - you get the picture. It's powerful and allows me to be in charge. I can tell you when I do water changes based on jumps in m y parameters from the graphs below (look at the ORP chart near the bottom - see those jumps? - yep, water change). You can also see when I've done something stupid - like let the trident run out of reagent for instance.


Last edited:
