Hey fellow reefers today I am wondering what would be the difference/benefit versus downside of one salinity level and another. Some reefers prefer 1.025 and other go with 1.026 what are you guy’s and gals’s preference and have you ever tried one versus the other. Did you see better growth amongst coral in one level or not. I would love to hear your experience with this if there is any
You are using an out of date browser. It may not display this or other websites correctly.
You should upgrade or use an alternative browser.
You should upgrade or use an alternative browser.
Salinity preference
- Thread starter Jeremey’s reef
- Start date
I always run 1.025 because it's the best* I've been running it for years and haven't actually tried anything else. Plus, I figure that if the calibration is a little off, 1.024 & 1.026 are also good so I'm covered.
*actually on my refractometer 1.025 had a nice bold hash mark and it's easy for me to see!
*actually on my refractometer 1.025 had a nice bold hash mark and it's easy for me to see!
Eric_n_Ga
Well-Known Member
.024-.026 is fine . It's going to move a little with evaporation anyway.
- Messages
- 4,441
- Reaction score
- 1,331
I target 35ppt which is basically 1.026. I believe that's the salinity of the ocean so I guess that's good enough for me. 
My opinion is also that 1.024-1.026 is acceptable. However, the point you may wish to target depends on your tank use.
For example; an LFS would prefer 1.026. This is because they are constantly selling frags, triggering the ATO as they remove more and more water. By the end of the day, the salinity could drop 0.004. So by aiming at the higher end of the spectrum, they are able to keep their coral within acceptable limits for longer without having to increase salinity manually. This means more time spent with customers and making sales.
However, if you’re about to leave town for a long time and are worried about your ATO having enough water, you may choose to target 1.024. If/when your ATO runs out, you may now have an extra day as your salinity increases to 1.026, before it gets too high.
Fwiw,
The oceans vary from around 3% up to around 4% salinity (30-40 ppt). This can depend on geography & season. The 3.5% (35 ppt) number is an average.
‘https://sos.noaa.gov/datasets/sea-surface-salinity-monthly-real-time/
The oceans vary from around 3% up to around 4% salinity (30-40 ppt). This can depend on geography & season. The 3.5% (35 ppt) number is an average.
‘https://sos.noaa.gov/datasets/sea-surface-salinity-monthly-real-time/
All seem to be great points... thank you all for your input
Fwiw,
The oceans vary from around 3% up to around 4% salinity (30-40 ppt). This can depend on geography & season. The 3.5% (35 ppt) number is an average.
‘https://sos.noaa.gov/datasets/sea-surface-salinity-monthly-real-time/
Very Interesting! Thanks for the link! I think the red (trending towards 40ppm) overlaps with a few reefs I know of.
I wonder what is range for coral reef salinity (as opposed to global oceans), if different reefs have significantly different average salinities, and what is the range of variability of this salinity over the course of the year?
- Messages
- 4,441
- Reaction score
- 1,331
Bill always has the best information. That's a really great point. Phosphates, nitrates, temperature... everything can change and it goes to show that our corals are hardier than we give them credit for.Fwiw,
The oceans vary from around 3% up to around 4% salinity (30-40 ppt). This can depend on geography & season. The 3.5% (35 ppt) number is an average.
‘https://sos.noaa.gov/datasets/sea-surface-salinity-monthly-real-time/
Ok. so I'm at work, and waiting on a co-worker to finish with a report for me to edit, any moment now... and decided to dive down the rabbit hole of salinity and coral reefs. Boy, I'm a nerd.
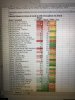
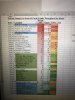
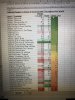
Ch. 6: Effects of Salinity on Coral Reefs, by Stephen L. Coles and Paul L. Jokiel
I found 1 resource that has a table (I love data). This information is compiled from a variety of sources. So I typed up the salinity range data for all areas of coral growth from around the world... then I simply added a 'difference' column to calculated the range of variability.
There are 3 things I find interesting about this data.
1) Some salinities are quite extreme, ranging from a low of 25% up to 52%. It makes me interested in the quality of the data; as I'm not sure how many data points are used in each individual point (again, it is a compilation from multiple sources).
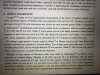
2) When sorting by the Lower % in their range, there is a disproportional tendency towards having a higher variation (difference) at lower %'s. I would hypothesize such variation could be caused by storms, typhoons, monsoons, and could be an explanation for all/any points of high variability. A later portion in this book dives into the short term effects of different salinities on individual coral species; indicating survival for X hours at Y% salinity, with many of these durations lasting from just minutes up to a couple days. This would support that lower numbers could be caused by temporary influxes of freshwater from regional storms.
3) Once you reach about 33% up to 36.6%, there is an unusual grouping in which the variability decreases to ~1%. However, there are a few data points with similar grouping at higher percentages; Christmas Is. Saline Lake which ranges from 51% to 52% being the most extreme example. I am curious if these data points are correct (see #1). If so, I am dumbfounded as to how corals grow in Bahrain, high salinity and high variability, and which species they are!
Pardon the ugly charts
(I just finished, and the report arrived! back to work for me!)
Ch. 6: Effects of Salinity on Coral Reefs, by Stephen L. Coles and Paul L. Jokiel
I found 1 resource that has a table (I love data). This information is compiled from a variety of sources. So I typed up the salinity range data for all areas of coral growth from around the world... then I simply added a 'difference' column to calculated the range of variability.
There are 3 things I find interesting about this data.
1) Some salinities are quite extreme, ranging from a low of 25% up to 52%. It makes me interested in the quality of the data; as I'm not sure how many data points are used in each individual point (again, it is a compilation from multiple sources).
2) When sorting by the Lower % in their range, there is a disproportional tendency towards having a higher variation (difference) at lower %'s. I would hypothesize such variation could be caused by storms, typhoons, monsoons, and could be an explanation for all/any points of high variability. A later portion in this book dives into the short term effects of different salinities on individual coral species; indicating survival for X hours at Y% salinity, with many of these durations lasting from just minutes up to a couple days. This would support that lower numbers could be caused by temporary influxes of freshwater from regional storms.
3) Once you reach about 33% up to 36.6%, there is an unusual grouping in which the variability decreases to ~1%. However, there are a few data points with similar grouping at higher percentages; Christmas Is. Saline Lake which ranges from 51% to 52% being the most extreme example. I am curious if these data points are correct (see #1). If so, I am dumbfounded as to how corals grow in Bahrain, high salinity and high variability, and which species they are!
Pardon the ugly charts
(I just finished, and the report arrived! back to work for me!)
Attachments
Last edited:
I dont know what I just read. But if its coming for you then....i vote yes.Ok. so I'm at work, and waiting on a co-worker to finish with a report for me to edit, any moment now... and decided to dive down the rabbit hole of salinity and coral reefs. Boy, I'm a nerd.
Ch. 6: Effects of Salinity on Coral Reefs, by Stephen L. Coles and Paul L. Jokiel
I found 1 resource that has a table (I love data). This information is compiled from a variety of sources. So I typed up the salinity range data for all areas of coral growth from around the world... then I simply added a 'difference' column to calculated the range of variability.
There are 3 things I find interesting about this data.
1) Some ranges are quite extreme, ranging from a low of 25% up to 52%. It makes me interested in the quality of the data; as I'm not sure how many data points are used in each individual point (again, it is a compilation from multiple sources).
2) When sorting by the Lower % in their range, there is a disproportional tendency towards having a higher variation (difference) at lower %'s. I would hypothesize such variation could be caused by storms, typhoons, monsoons, and could be an explanation for all/any points of high variability. A later portion in this book dives into the short term effects of different salinities on individual coral species; indicating survival for X hours at Y% salinity, with many of these durations lasting from just minutes up to a couple days. This would support that lower numbers could be caused by temporary influxes of freshwater from regional storms.
3) Once you reach about 33% up to 36.6%, there is an unusual grouping in which the variability decreases to ~1%. However, there are a few data points with similar grouping at higher percentages; Christmas Is. Saline Lake which ranges from 51% to 52% being the most extreme example. I am curious if these data points are correct (see #1). If so, I am dumbfounded as to how corals grow in Bahrain, and which species they are!
Pardon the ugly charts
(I just finished, and the report arrived! back to work for me!)
")
I dont know what I just read. But if its coming for you then....i vote yes.
LMAO... maybe it'd make more sense to look at the attached chart photos for a few seconds and then read my post. You're right, it's a mildly dense post.
I still vote yes. lolLMAO... maybe it'd make more sense to look at the attached chart photos for a few seconds and then read my post. You're right, it's a mildly dense post.
Thanks Jin
By the math, salinity can vary globally as much as +\- 14+ % from the average.
The Red Sea for example is known to have abnormally high salinity, due to isolation, heat and lack of rain.
Temps for acropora exposed at low tide on the Great Barrier Reef can well exceed 90 deg. F.
(Don’t try this at home!)
Hardy indeed!

 www.nature.com
By the math, salinity can vary globally as much as +\- 14+ % from the average.
The Red Sea for example is known to have abnormally high salinity, due to isolation, heat and lack of rain.
Temps for acropora exposed at low tide on the Great Barrier Reef can well exceed 90 deg. F.
(Don’t try this at home!)
Hardy indeed!
Limits to the thermal tolerance of corals adapted to a highly fluctuating, naturally extreme temperature environment - Scientific Reports
Naturally extreme temperature environments can provide important insights into the processes underlying coral thermal tolerance. We determined the bleaching resistance of Acropora aspera and Dipsastraea sp. from both intertidal and subtidal environments of the naturally extreme Kimberley region...
www.nature.com

Thanks Jin
By the math, salinity can vary globally as much as +\- 14+ % from the average.
The Red Sea for example is known to have abnormally high salinity, due to isolation, heat and lack of rain.
Temps for acropora exposed at low tide on the Great Barrier Reef can well exceed 90 deg. F.
(Don’t try this at home!)
Hardy indeed!
Limits to the thermal tolerance of corals adapted to a highly fluctuating, naturally extreme temperature environment - Scientific Reports
Naturally extreme temperature environments can provide important insights into the processes underlying coral thermal tolerance. We determined the bleaching resistance of Acropora aspera and Dipsastraea sp. from both intertidal and subtidal environments of the naturally extreme Kimberley region...
Very cool! I’m printing this paper now and will read soon.
And I definitely will not try this at home.
When you say +/- 14%, are you still talking about reefs, or oceans in general? And are those just momentary measurements, or averages over time. Sorry for all the questions; I’m sure I’ll find it all in the paper later. Just curious
When I started in the hobby I was keeping my tank at 35ppt/1.0264. With a large system and an Osmolator running the ATO I didn't see much of a swing from evaporation. I switched to 33ppt/1.025 after a conversation here and reading up some on R2R. There was nothing to scientific in the reasoning. Mainly that it was easier to mix up and used a little less salt mix. I felt that as long as the big 3 were still in line everything would be fine and it was.
Here's some more data, a little old but data
 www.reddit.com
Here's some more data, a little old but data
Reddit - Dive into anything
www.reddit.com
The salinity variance is a global max/min. I’ve not dissected the data, but would expect most reefs in open oceans to be much more stable. As mentioned above, the Red Sea is an anomaly, due to a unique combination of factors. Significantly lower salinity can be seen near areas of abnormally high rainfall or snowmelt. The Amazon basin is an example.
Fwiw,
Years ago I used to keep my tank salinity around 1.023.
The reasoning was that it reduced the osmotic gradient, making it easier for organisms to stay hydrated.
Saltwater animals expend more energy on this than freshwater animals do.
Years ago I used to keep my tank salinity around 1.023.
The reasoning was that it reduced the osmotic gradient, making it easier for organisms to stay hydrated.
Saltwater animals expend more energy on this than freshwater animals do.
that makes sense.
The link and data I posted earlier is specifically for living reefs, not just oceans. There is still a lot of variance that looks curious. It really looks quite interesting if you’re wanting reading material.
I already printed your article, and added it to my Mendeley. Lol.
The link and data I posted earlier is specifically for living reefs, not just oceans. There is still a lot of variance that looks curious. It really looks quite interesting if you’re wanting reading material.
I already printed your article, and added it to my Mendeley. Lol.
Similar threads
- Replies
- 4
- Views
- 207
- Replies
- 10
- Views
- 547