I made this after a tank crash, thought I would stop trying to use the old gut and feeling water testing path and it didn't work, then I had some medical problems and couldn't properly take care of my tank to my standards. Tank was unstable for a bit but I am now seeing a lot of value tracking my parameters and using graphs to see they full picture of how things are going and ID potential problems before they get bad.
Mods - Is there a way to attach an .xls to a post?
Members Only - If you would like a copy to track your own water, feel free to DM me with your email address if I can't get the excel spreadsheet loaded on here. Please note, I do not plan on teaching excel to anyone or customizing (however, I could be persuaded with some nice frags).
Directions:
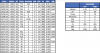
- Go to 'Reef Stats' tab and fill out your most recent test results

- Now you have your raw data entered
- Go to 'Salinity' tab. Right click the table on the top left and hit 'Refresh'

- Now you have inserted the data from 'Reef Stats' into the rest of the spreadsheet.
- Now select the icon directly to the right of 'Row Labels'
- This will pull a dropdown menu with dates, check the dates you would like to see on the bar graph. Pro tip: if you left data blank on the 'Reef Stats' page, do not select that date to ensure the line graph stays connected.

- Repeat Step 3 for all of the tabs.