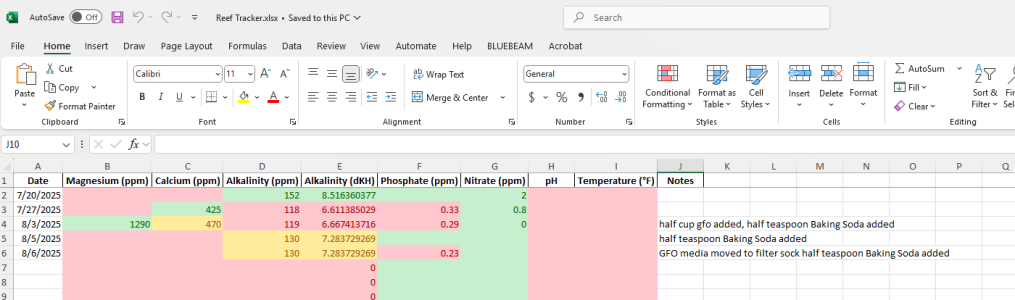
Spent over 9000 hours with ChatGPT and came up with this. If anyone would like to use it. You can input the parameters on the main tab and it generates charts for each parameter on separate tabs. I'm sure there are a million apps and what not but here's a solution if you want it. It color codes inputs, yellow being 10% or less out of standard range, and yes my tank is a mess as it continues to recover from a vacation time power outtage.
-Edit cant upload spread sheets. If you want it PM an email address and I'll send.


-Edit cant upload spread sheets. If you want it PM an email address and I'll send.
Attachments
Last edited:


 Also log every time I make a change to dosing amounts. Gotta be honest, it has been extremely helpful in dialing everything in. I can’t imagine testing and not tracking the data.
")